Debugging slow pytorch training performance
# December 21, 2022
The slowest thing in an ML training pipeline should be the numerical computation, since this is the meaningful work that the GPU is doing. I hit an issue the other day where the utilization of the GPU during training was very low (sub 20%) despite > 90% memory allocation. Typically utilization is a function of memory (batch size, model params size, etc) and how quickly data tensors can be streamed over to the GPU memory (size of tensors, number of data loaders, etc). If that overall utilization is too low you've leaving valuable compute on the table.
In this particular case: batch size was high and data tensors were pretty small. So the most likely culprit was some blocking operation in the training loop (like a GPU -> CPU syncronization) or slowdown in fetching the data from disk. This post covers some iterative debugging using:
- Image-based large datasets
- Pytorch Lightning
- Weights and Biasies
I started to profile Lightning with their integrated profiler. This profiler only echos once the fit loop is completed so I arbitrarily set to a lower amount of train batches.
from pytorch_lightning.profiler import SimpleProfiler
profiler = SimpleProfiler()

trainer = pl.Trainer(
    limit_train_batches=20,
    profiler=profiler,
    max_epochs=1,
)
The top entries here were:
| Action | Mean duration (s) | Num calls | Total time (s) | Percentage % |
|---|---|---|---|---|
| Total | - | 932 | 177.11 | 100% |
| run_training_epoch | 152.12 | 1 | 152.12 | 85.89% |
| [TrainingEpochLoop].train_dataloader_next | 5.589 | 20 | 111.78 | 63.115% |
| run_training_batch | 1.6563 | 20 | 33.125 | 18.704% |
| [LightningModule]WebpageTrainingModule.optimizer_step | 1.6541 | 20 | 33.082 | 18.679% |
| [Strategy]SingleDeviceStrategy.training_step | 1.2839 | 20 | 25.679 | 14.499% |
| [Callback]TQDMProgressBar.on_train_batch_end | 0.31069 | 20 | 6.2138 | 3.5085% |
| [Callback]ModelCheckpoint.on_train_epoch_end | 2.5892 | 1 | 2.5892 | 1.4619% |
Specifically train_dataloader_next is taking up 111 seconds. This is highly suspect considering the data is already pre-downloaded on disk. We are doing a few CPU-bound resizing operations within the data loader so it's possible this has something to do with it.
There are multiple parameters to DataLoader that might be affecting the performance. In our case, batch size 512 with 12 separate loaders just serializing data from disk and resizing.
data_loader = torch.utils.data.DataLoader(
    dataset,
    num_workers=cpu_count(), # 12 cores
    batch_size=BATCH_SIZE, # hard coded 512 to maximize GPU memory
    persistent_workers=True,
    pin_memory=True,
    prefetch_factor=200,
)
With this fully parameterized, we see:
start = time()

new_dataset_iter = iter(data_loader)
for i in range(20):
    next(new_dataset_iter)

print("Timestamp data load", time() - start)

> 147.34973645210266
In case it was some subtle pin-memory issue, we redo the benchmark with pin_memory=False:
Timestamp data load 142.86962890625
Tinkering with some of the other parameters (including prefetch_factor) didn't materialy affect our timestamp loading, so it's likely something intrinsic in the amount of data that is being loaded. Still - this analysis helps us isolate the problem by using a simpler dataloader config. Less going on here than before.
data_loader = torch.utils.data.DataLoader(
    dataset,
    num_workers=cpu_count(),
    batch_size=BATCH_SIZE,
    prefetch_factor=200,
)
We now want to get more specific about our dataset. Let's log the actual creation time averages:
class DatasetWrapper(torch.utils.data.IterableDataset):
    def __init__(self, datasets, image_size):
        super().__init__()
        self.datasets = datasets

        self.transform = torchvision.transforms.Compose([
            torchvision.transforms.Resize(image_size),
            torchvision.transforms.CenterCrop(image_size)
        ])

    def __iter__(self):
        sources = [iter(ds) for ds in self.datasets]
        while True:
            for source in sources:
                try:
                    start = time()
                    image = next(source)[0]
                    elapsed_fetch = time()-start

                    start = time()
                    image =  self.transform(image)
                    elapsed_transform = time()-start

                    yield {
                        "image_embedding": image,
                        "elapsed_fetch": elapsed_fetch,
                        "elapsed_transform": elapsed_transform,
                    }
                except (StopIteration, KeyboardInterrupt):
                    return
                except Exception as e:
                    print("Dataloader exception encountered", e)
                    continue

# We run this 20 times
start = time()

new_dataset_iter = iter(data_loader)
for i in range(20):
    datapoint = next(new_dataset_iter)
    wandb.log({"datapoint-prepare-time": datapoint["elapsed"].mean()})

print("Timestamp data load", time() - start)
quit()
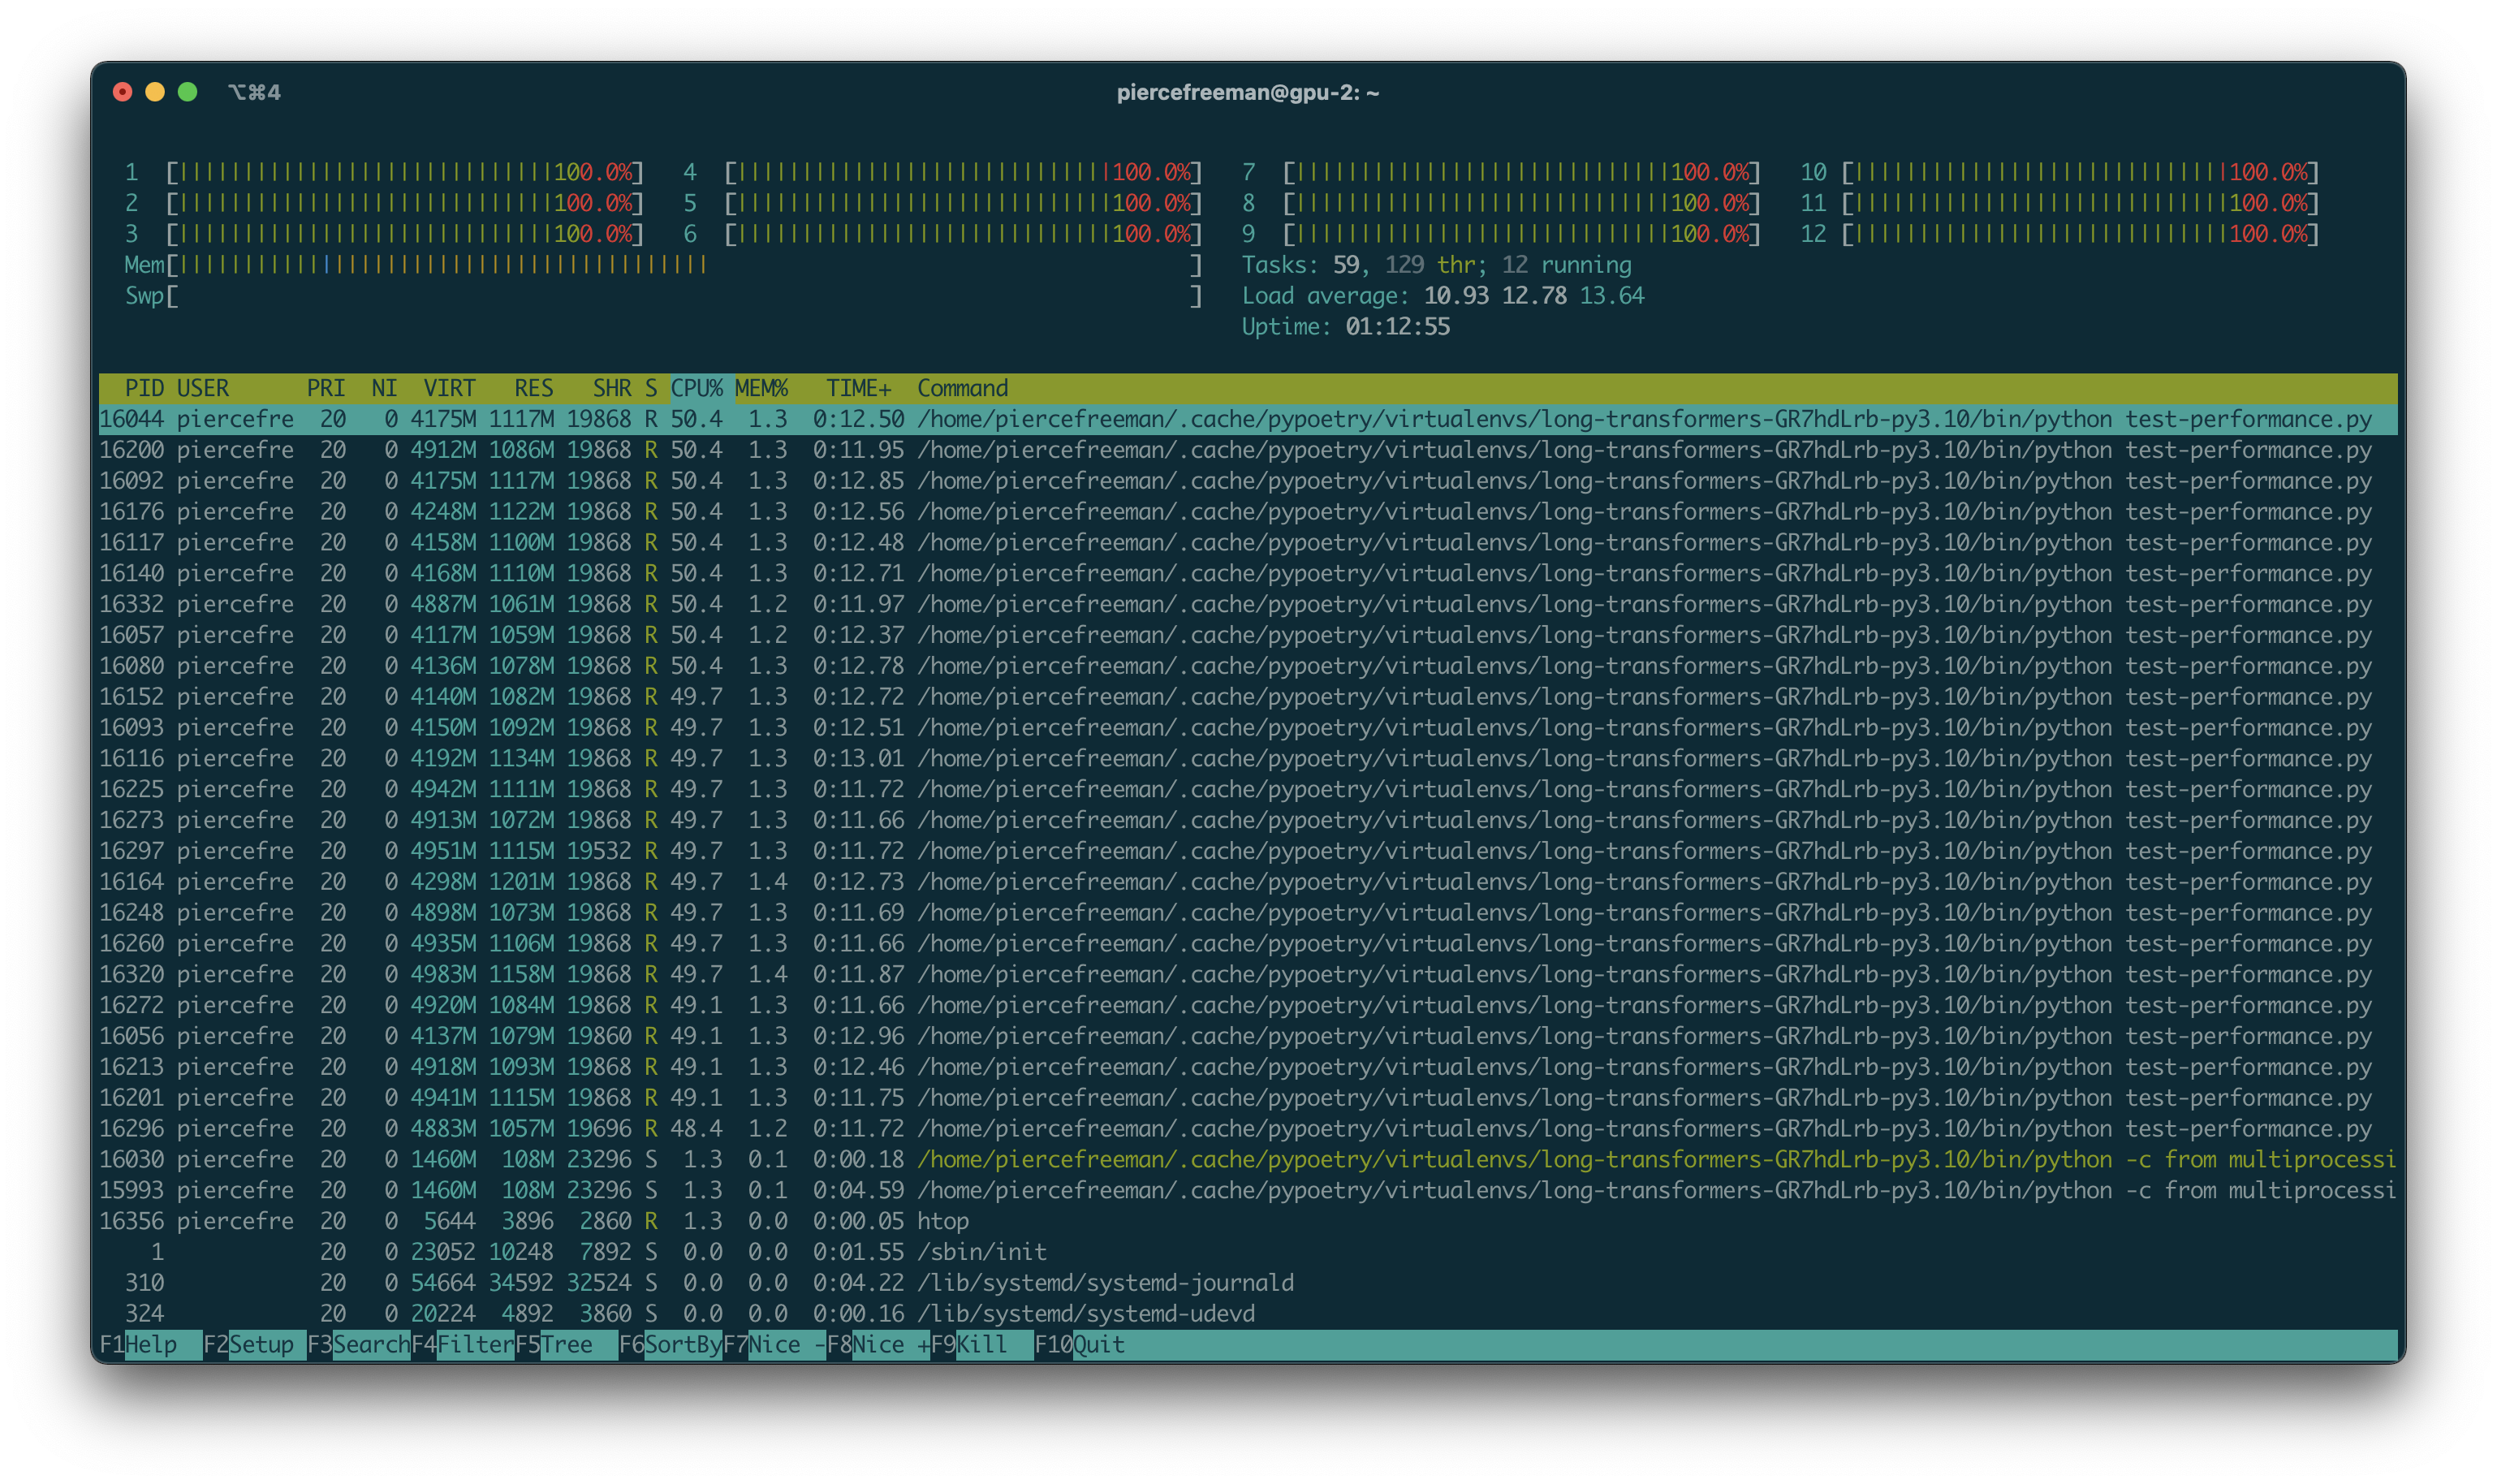
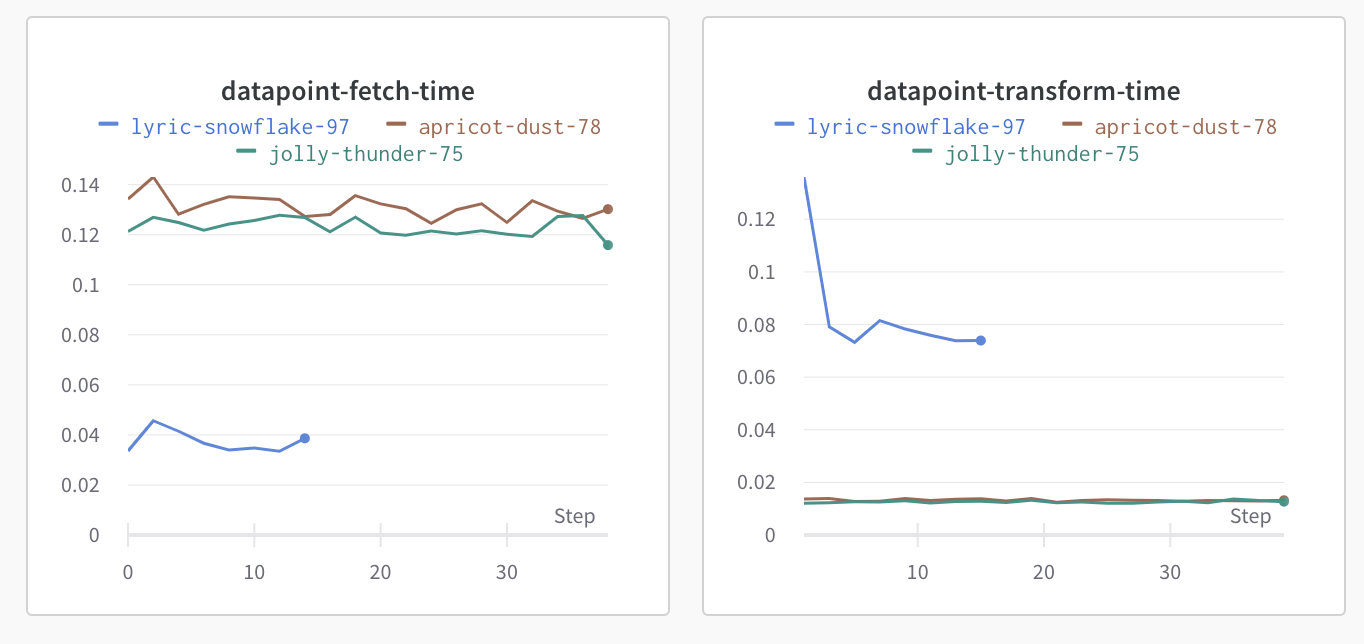
This outputs into a wandb graph. X axis is the current batch number, Y axis is the time it took to fetch and transform the dataset. I find breaking down preprocessing timing into separate test runs, and logging these centrally, is the best way to trace down these bugs systematically.

When we combine the averages of both fetching and transformation, let's say we have an average of ~0.14 seconds. There's 512 items, 20 batches so 1433.2 seconds total to process. Since we have 12 workers that means 119 seconds of processing time. This is about as we originally expected. Throughout this time we can also visualize the active processes to confirm that we are not seeing any under allocated workers.
Based on the graph the main cost is on the fetch time (fetch=0.13s versus transform=0.013s). Let's break down fetching.
We first confirm we don't have any outbound network requests during the training. And we don't; every datapoint is read from a tarballed file on disk that gets serialized into a wds.WebDataset. What exactly is taking this time?
Disk speed might be a part of it - since the original trial were conducted on a pd-standard disk which is a spinning HDD1. We switch to a pd-ssd and perform this test. Those results are in the graph above. apricot-dust-78 is on the ssd, so it took more time not less to read the same file from disk. We chalk this up to some randomness in seek access times and that disk io is certainly not our blocker.
A quick validation of SSD disk speed confirms io is not our bottleneck:
$ sudo hdparm -Tt /dev/sda1

/dev/sda1:
 Timing cached reads:   20210 MB in  1.99 seconds = 10139.35 MB/sec
 Timing buffered disk reads: 1350 MB in  3.00 seconds = 449.48 MB/sec
With this hypothesis ruled out, we suspect having to uncompress the regular tarball. The format contains both text metadata and the image itself. For our case we just care about the image.
$ tar -tvf ./laion-high-resolution-output/00000.tar

-r--r--r-- bigdata/bigdata 155962 2022-12-20 16:31 000000008.jpg
-r--r--r-- bigdata/bigdata    959 2022-12-20 16:31 000000008.json
-r--r--r-- bigdata/bigdata     54 2022-12-20 16:31 000000008.txt
-r--r--r-- bigdata/bigdata 131448 2022-12-20 16:31 000000010.jpg
-r--r--r-- bigdata/bigdata    617 2022-12-20 16:31 000000010.json
-r--r--r-- bigdata/bigdata    110 2022-12-20 16:31 000000010.txt
-r--r--r-- bigdata/bigdata 174363 2022-12-20 16:31 000000035.jpg
-r--r--r-- bigdata/bigdata    802 2022-12-20 16:31 000000035.json
-r--r--r-- bigdata/bigdata    229 2022-12-20 16:31 000000035.txt
-r--r--r-- bigdata/bigdata 776225 2022-12-20 16:31 000000017.jpg
-r--r--r-- bigdata/bigdata   1485 2022-12-20 16:31 000000017.json
-r--r--r-- bigdata/bigdata     72 2022-12-20 16:31 000000017.txt
-r--r--r-- bigdata/bigdata 540699 2022-12-20 16:31 000000007.jpg
-r--r--r-- bigdata/bigdata    522 2022-12-20 16:31 000000007.json
-r--r--r-- bigdata/bigdata     15 2022-12-20 16:31 000000007.txt
-r--r--r-- bigdata/bigdata 135125 2022-12-20 16:31 000000067.jpg
-r--r--r-- bigdata/bigdata    574 2022-12-20 16:31 000000067.json
-r--r--r-- bigdata/bigdata     52 2022-12-20 16:31 000000067.txt
-r--r--r-- bigdata/bigdata 416644 2022-12-20 16:31 000000038.jpg
-r--r--r-- bigdata/bigdata    512 2022-12-20 16:31 000000038.json
-r--r--r-- bigdata/bigdata     30 2022-12-20 16:31 000000038.txt
-r--r--r-- bigdata/bigdata 317730 2022-12-20 16:31 000000070.jpg
-r--r--r-- bigdata/bigdata    564 2022-12-20 16:31 000000070.json
-r--r--r-- bigdata/bigdata     55 2022-12-20 16:31 000000070.txt
-r--r--r-- bigdata/bigdata  73835 2022-12-20 16:31 000000004.jpg
-r--r--r-- bigdata/bigdata    558 2022-12-20 16:31 000000004.json
Let's load images one-by-one and see if we can do better. We start by extracting the images from the tarballs and saving them on disk as independent files:
$ cd ./laion-high-resolution-output && for f in *.tar; do tar --wildcards -xvf "$f" "*.jpg"; done
# V2
from multiprocessing import cpu_count
import torchvision
import webdataset as wds

train_url = "./laion-high-resolution-output/data_0000"

class DatasetWrapper(torch.utils.data.IterableDataset):
    def __init__(self, datasets, image_size):
        super().__init__()
        self.images = [
            path
            for path in Path(train_url).iterdir()
            if "jpg" in str(path)
        ]

        self.transform = torchvision.transforms.Compose([
            torchvision.transforms.Resize(image_size),
            torchvision.transforms.CenterCrop(image_size),
        ])

    def __iter__(self):
        for path in tqdm(self.images):
            try:
                start = time()
                image = torchvision.io.read_image(str(path))
                elapsed_1 = time()-start

                start = time()
                image =  self.transform(image)
                elapsed_2 = time()-start
                yield {
                    "image_embedding": image,
                    "elapsed_fetch": elapsed_1,
                    "elapsed_transform": elapsed_2
                }
            except StopIteration:
                return
            except KeyboardInterrupt:
                break
            except Exception as e:
                print("Dataloader exception encountered", e)
                continue
Blue is the latest. Fetch has been reduced but transform is increasing. That's a bit counter-intuitively since fetch is already converting to a tensor.
There's a lot happening internally in torchvision so debugging there is a last resort. Let's quickly try a slightly lower level PIL implementation that uses raw numpy transformations to convert the image into floating points and do the transformation once we already have a tensor:
start = time()
im = PIL.Image.open(path)
im.draft('RGB',(256,256))
image = np.asarray(im)
elapsed_1 = time()-start

start = time()
image = transform(image)
elapsed_2 = time()-start
We run this in the same data loader pipeline as before:
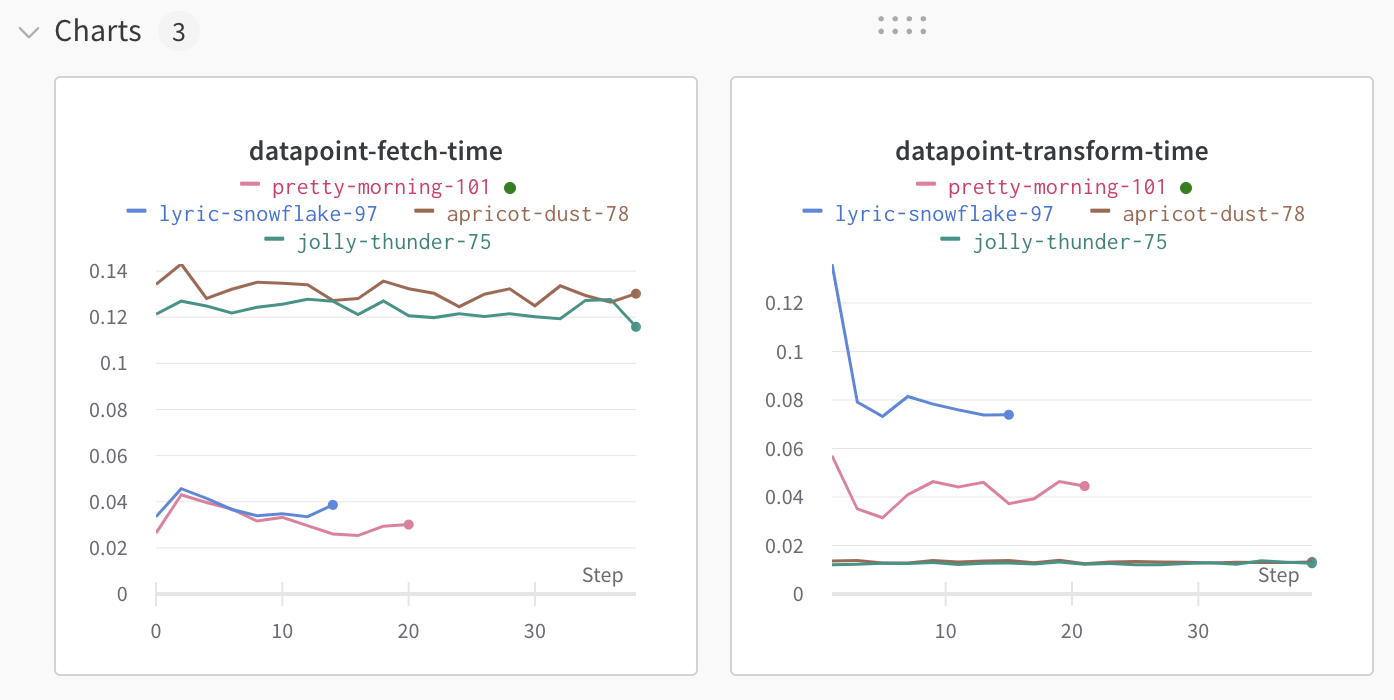
pretty-morning-101 is the combination of the two approaches: extracting images directly and numpy conversion. A big improvement, although still slower on processing versus our jolly-thunder-75. After these optimizations we're down to 0.08s per datapoint so we can expect 64s of processing time for the whole dataset.
Caching full values
An alternative approach is to decrease almost all CPU computation that we have to do within the training loop by pre-processing the data.
We can POC that approach briefly even with our existing dataloader, by just iterating through it and caching the values in memory. We confirm CPU utilization goes to zero.
from tqdm import tqdm

class CachedDataset(torch.utils.data.Dataset):
    def __init__(self, *args, max_size, **kwargs):
        iter_dataset = Dataset(*args, **kwargs)
        print("Starting to preprocess caching...")
        dataset_iter = iter_dataset.make_iter(0, len(iter_dataset.all_paths))
        self.datapoints = [
            next(dataset_iter)
            for _ in tqdm(range(max_size))
        ]
        print("Finished preprocess caching")

    def __getitem__(self, i):
        return self.datapoints[i]

    def __len__(self):
        return len(self.datapoints)
Benchmarking shows that this approach is significantly faster:
| Action | Mean duration (s) | Num calls | Total time (s) | Percentage % |
|---|---|---|---|---|
| Total | - | 1572 | 109.01 | 100% |
| run_training_epoch | 99.986 | 1 | 99.986 | 91.724% |
| run_training_batch | 4.3576 | 20 | 87.151 | 79.95% |
| [LightningModule]WebpageTrainingModule.optimizer_step | 4.3277 | 20 | 86.554 | 79.402% |
| [Strategy]SingleDeviceStrategy.training_step | 3.065 | 20 | 61.3 | 56.235% |
| [Strategy]SingleDeviceStrategy.backward | 1.2203 | 20 | 24.407 | 22.39% |
| [Strategy]SingleDeviceStrategy.validation_step | 0.63823 | 22 | 14.041 | 12.881% |
| [Callback]ModelCheckpoint | 2.4134 | 1 | 2.4134 | 2.214% |
| [EvaluationEpochLoop].None_dataloader_idx_0_next | 0.17494 | 2 | 0.34988 | 0.32097% |
So much faster in fact that train_dataloader_next doesn't even appear in the profiler. Timing for this is trivial and we're just optimizing for the training_step GPU operations.
Since this dataloader wrapper is so easy to implement, I'm going to start running it when benchmarking my initial GPU utilization. With everything cached, utilization should be close to max. If not you have an issue somewhere else in your computation graph.
In a real pipeline you obviously can't cache the entire dataset in memory. But this does give us a good baseline for how much CPU processing we're doing. And the common workaround is to spawn the preprocessing on a separate device, either before your training or in parallel, and have your GPU training loop just serialize these dense tensors directly from disk.
Conclusion
The most common cause of slow training are often non-GPU operations. And one of the heavier CPU tasks is often the data pipeline. The best way to debug this is to first isolate the bottleneck by using the profiler and then break down the problem into functional steps that can be independently benchmarked.
Sure, even if you can get your GPU utilization close to 100%, training a big model can still take weeks. But you know you're using your hardware as efficiently as possible. And that helps me sleep far better.
-
I originally discounted the disk read theory, since we're linearly reading a tar file and shouldn't be doing any random access. But since there's a lot of background activity during training that we don't directly control (including writing logs to a disk cache) I thought it was worth making sure that disk IO was not the culprit. ↢